- Mon 08 December 2025
- Python
How did Netflix go from DVD rental company to dominating global streaming service? I analyzed 8,700+ Netflix titles (2008-2021) from Kaggle using Pandas to decode their content strategy across countries, formats and genres.
You can find the complete code for this analysis here.
Analysis and Findings:
1. How Did Netflix Content Volume Evolve Between 2008-2021?
df_result = df.groupby(['year_added','type']).size().unstack(fill_value=0).reset_index()
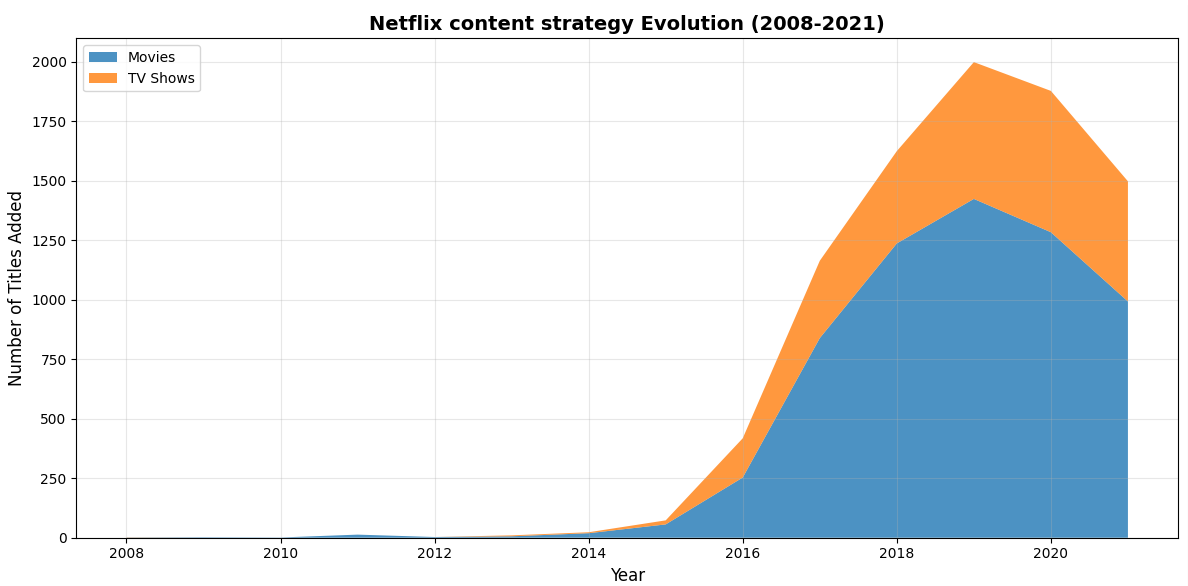
- Netflix was founded in 1997 as a DVD rental business, but they waited for internet infrastructure and its costs to improve in the US (2007-08) to start the streaming service.
- Between 2008 and 2014, Netflix added only 54 titles in total, reflecting the slow transition from DVD rentals to streaming through licensing.
- Then the explosive growth of Netflix started in January 2016, when they expanded to 130+ countries. We can see a 5.7x surge in content additions: from 73 titles (2015) to 418 titles(2016).
- Movies peaked in 2019 with 1424 titles, while TV Shows peaked in 2020 with 594 titles.
- After adding 1,999 titles in 2019, Netflix content additions fell 25% by 2021.
- Intense competition started in 2019, when major media companies started their own streaming services, they stopped licensing content to Netflix. This explains the post-2019 decline in content additions to Netflix.
- Additionally, COVID-19 disrupted global content production in 2020.
Now let's see whether Netflix used old or new content to ramp up this volume.
2. How Recent is Netflix's Content?
df.groupby('type')['content_age'].describe()
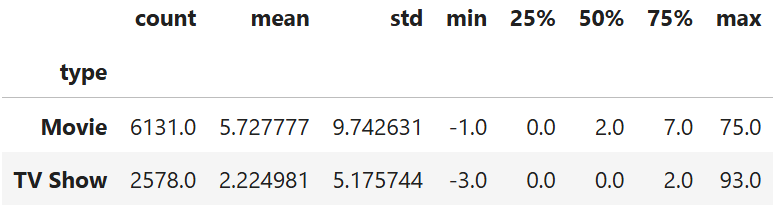
content_ageis a derived column (year_added-release_year).- TV Shows: Median age is 0 years(added same year as release).
- Movies: Median age is 2 years.
Why TV Shows are Added Sooner: In their early years, Netflix licensed TV Shows from media companies and added them to their catalogue within a year of each season's original release. These were either reruns after the season ended or added just before the new season to draw in new viewers. From 2012 onwards, Netflix began producing its own content labeled as "Netflix Originals", which are available from day one.
Movie windows: Movies still follow traditional distribution: theatrical releases -> premium video on demand -> streaming. Hence the delay in adding movies to Netflix.
3. Which Countries Dominates Netflix's Catalog and Does Content Type Vary by Region?
- To answer this, I split multi-country entries (e.g., "United States, India, United Kingdom") into separate rows, then counted titles per country.
df_country = df[['country', 'type']].copy()
df_country['country'] = df_country['country'].str.split(', ')
df_exploded = df_country.explode('country')
# ...
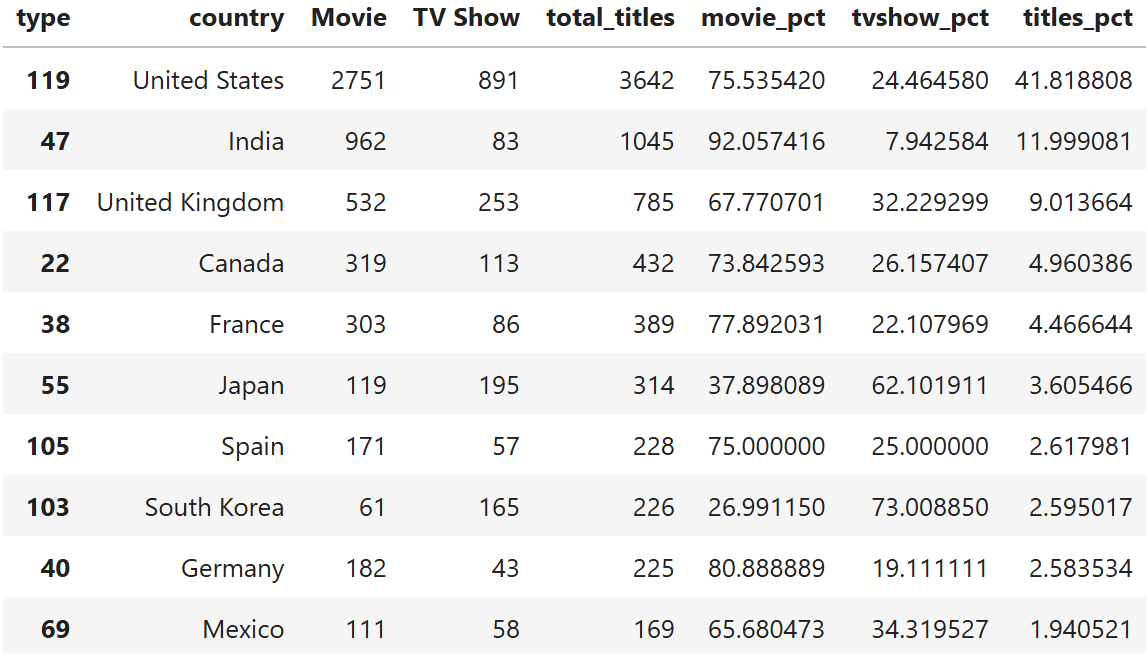
- The United States dominates the catalog with 3,642 titles, accounting for about 42% of all content on Netflix.
- The top five content producing countries are: United States, India, UK, Canada, and France.
- Movie-Heavy Countries: India(92%), Germany(81%) and France(78%).
- TV Show-Heavy Countries: South Korea(73%) and Japan(62%).
Why These Patterns Exist:
India's Movie Focus: In India, historically cinema has been the primary entertainment medium, while TV content lagged in production quality. Netflix's Indian catalog reflects this cinema-first culture, though streaming platforms are now elevating the TV Show quality.
Japan's TV Dominance: Japanese TV content heavily features Anime series adapted from Manga, which come with in-built fan bases. This makes serialized anime production more commercially viable than standalone films.
South Korea's K-Drama Strategy: Two key reasons that made K-Dramas globally competitive, and their strong presence on Netflix are:
- Government policy: After the 1997 Asian financial crisis, South Korea strategically invested in "culture industries" (K-drama, K-pop) as low-capital export businesses, sparking the "Korean Wave" phenomenon.
- Economic Efficiency: The cost per minute of content for most of the TV Shows is less compared to movies.
This demonstrates Netflix's localization approach, matching content format with regional preferences rather than applying one-size-fits-all strategy. But did that mean the content reached only to local audiences? That's what the next section uncovers.
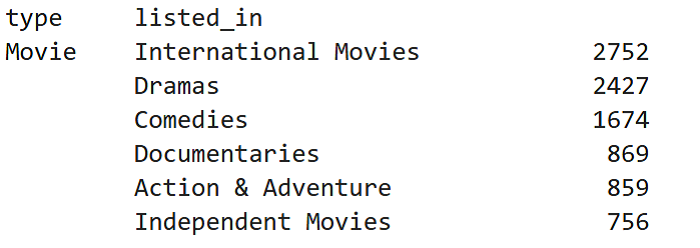
4. Which Genres Dominate Netflix's Library?
df_genres = df[['type','listed_in']].copy()
df_genres['listed_in'] = df['listed_in'].str.split(', ')
df_genres_exploded = df_genres.explode('listed_in')
df_genres_exploded['listed_in'] = df_genres_exploded['listed_in'].str.strip()
df_genres_groups = df_genres_exploded.groupby('type')
df_genres_groups['listed_in'].value_counts()
Overall Genre leaders:
- International content: 4,080 titles.
- Drama: 3,166 titles (36% of catalog).
- Comedy: 2,224 titles(26%).
- Movies favor: Documentaries, Action & Adventure and Independent Movies.
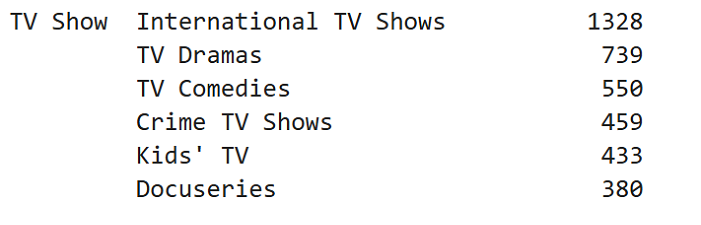
- TV Shows favor: Crime TV Shows, Kids' TV and Docuseries.
The International content strategy: The 'International' label refers to content originating outside the viewer's region (e.g., non-English or non-US content for US viewers). Netflix recognized that great stories can come from anywhere and strategically invested in 'International content' to attract global subscribers. Examples like 'Money Heist (Spain)', 'Squid Game (South Korea)', and 'Lupin (France)' validated this approach.
Why Drama dominates: 'Drama' creates emotional connections with audiences across all cultures. Additionally, dramas are cheaper to produce than Action, Sci-Fi, Adventure content(no stunts or CGI required), making them ideal for Netflix's volume-based content strategy.
Focus on True Crime: Netflix also focused more on "True Crime" docuseries/documentaries, as they have global appeal and also cost effective to produce.
5. Is Netflix Family-Friendly or Adult-Oriented?
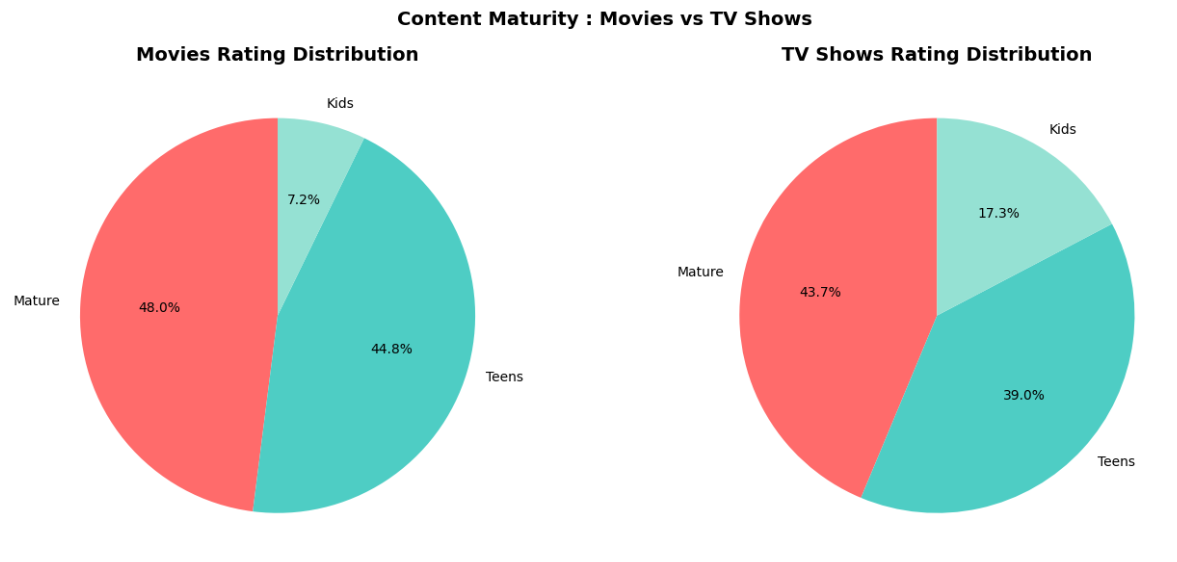
Rating Distribution:
- Mature content (TV-MA/R) 48% of Movies, 44% of TV Shows.
- Teen content (PG-13/TV-14): 45% of Movies, 39% of TV Shows.
- Kids content (G/TV-Y): 7% of Movies, 17% of TV Shows.
Nearly half (47%) of Netflix content is rated mature, restricted to audiences 17+. When combined with teen content, 90% of the platform's content requires 'parental guidance' or age restrictions.
Why Netflix Prioritizes Mature Content:
- Netflix's core paying subscribers are adults (18-49) and Netflix doesn't have any pressure from advertisers to influence content, so Netflix optimizes its content to this core audience to retain their subscription.
- By eliminating content restrictions, Netflix gave creative freedom for makers to tell their stories without any censorship restrictions.
This demonstrates Netflix's strategic positioning as a more adult-oriented platform, deliberately differentiating from family-friendly competitors like Disney+.
Content fit is important, but it can create an impact only when the release timing is right.
6. When Does Netflix Prefer to release Content?
6.1 Day-of-Week Patterns:
df_day_patterns = df[['type','day_added']].copy()
df_result = df_day_patterns.groupby('type')
df_result = df_result['day_added'].value_counts().reset_index(name='num_of_titles_added')
# ...
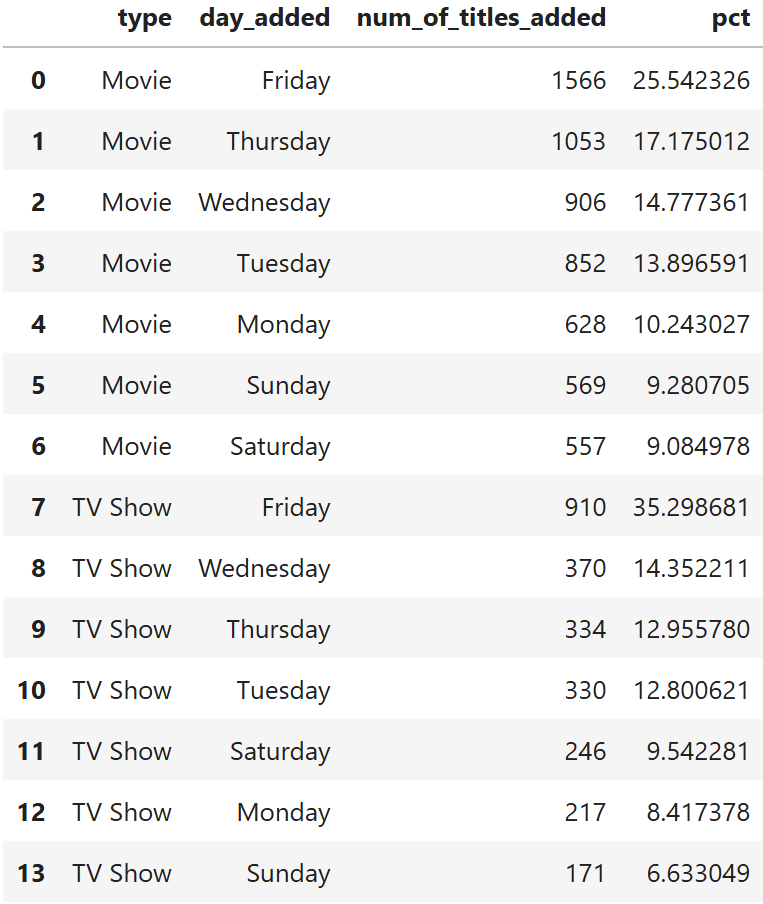
- Netflix adds content mostly on Fridays, which is similar to traditional theatrical releases.
- This likely lets viewers start watching on Friday, binge over the weekend and discuss it with friends or colleagues on Monday, creating free and effective word-of-mouth marketing.
- Saturdays and Sundays show the fewest releases.
6.2 Month-of-Year Patterns:
Global Patterns:
df_month_patterns = df[['type','month_name']].copy()
df_result = df_month_patterns.groupby('type')
df_result = df_result['month_name'].value_counts().reset_index(name='num_of_titles_added')
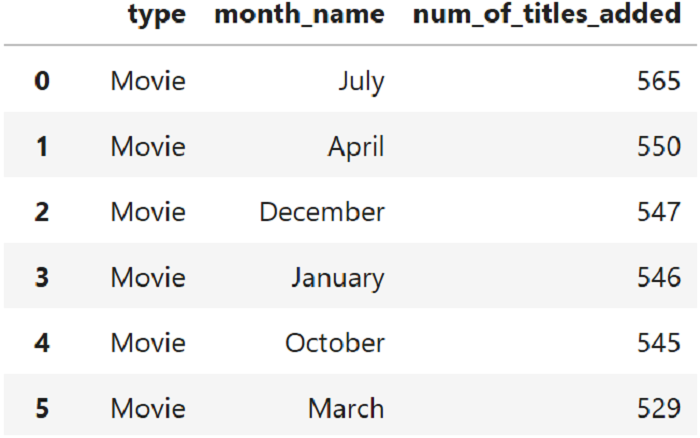

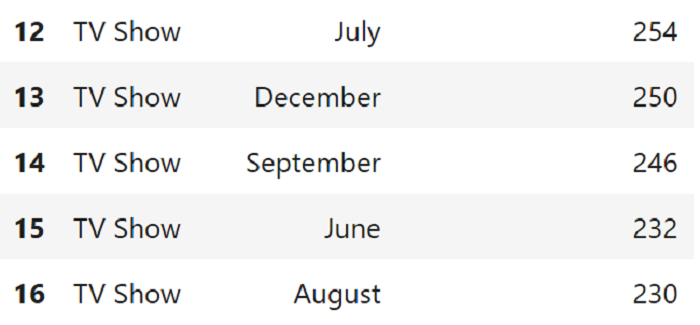

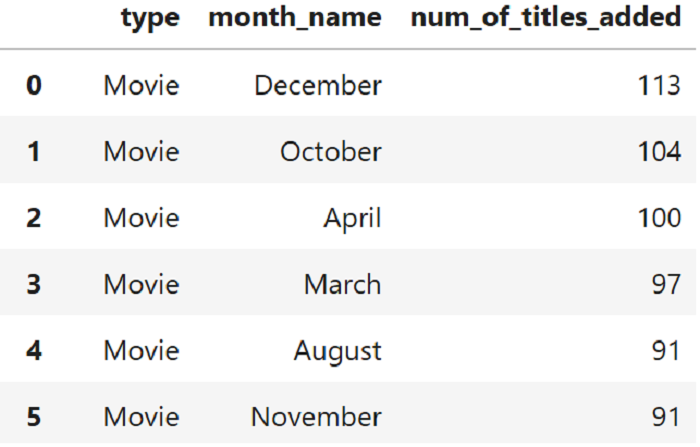
- July is the most active month to release new content, which coincides with the summer holiday season in the US and Europe.
- Second most preferred month for TV Shows is December, the holiday season in most Western countries.
- This indicates either Netflix's strategic holiday timing or simply when licensed content becomes available to add to Netflix.
- February has the lowest content additions for both categories.
India's Patterns:
df_ind = df_result.loc[Ind_filt]
df_ind = df_ind.groupby('type')
df_ind = df_ind['month_name'].value_counts().reset_index(name = 'num_of_titles_added')

- December - Christmas and New Year's Eve.
- October/November - Dussehra and Diwali festivals.
- April - Start of summer holidays for schools.
- Unlike the global July peak (summer in US/Europe), Indian content additions show patterns aligned with India's own holidays, likely reflecting either Netflix's localization strategy or Indian Film Industry's traditional holiday releases (or both).
Netflix's rise follows a clear pattern. The analysis highlights three major moves: aggressive content production (not just licensing) from 2016 onward that unlocked network effects (more content -> more users -> more revenue -> more content), a localization strategy that matched content formats to regional preferences like movies for India and TV shows for Japan and South Korea, and deliberate positioning with more mature content that differentiated Netflix from competitors.
All of these insights were uncovered by using Pandas to clean the messy data, run datetime manipulations, and perform groupby operations on 8,700+ Netflix titles.
You can find the complete code for this analysis here.